Get Started with Google Analytics 4. Google Analytics 4 is not simply the upgrade to Universal Analytics. It is an entirely new version and redesign of the tool. It is the new generation of Google Analytics that will allow you to collect data from both apps and web.
Watch the webinar recording below to discover the tool, understand how to use and navigate the new features and interface, and run through the main differences with Universal Analytics.
Need help migrating to Google Analytics 4? We can help.
Getting Started with Google Analytics 4
- What is Google Analytics 4?
- What’s new and different?
- What does Google Analytics 4 look like?
- What’s next?
What is Google Analytics 4?
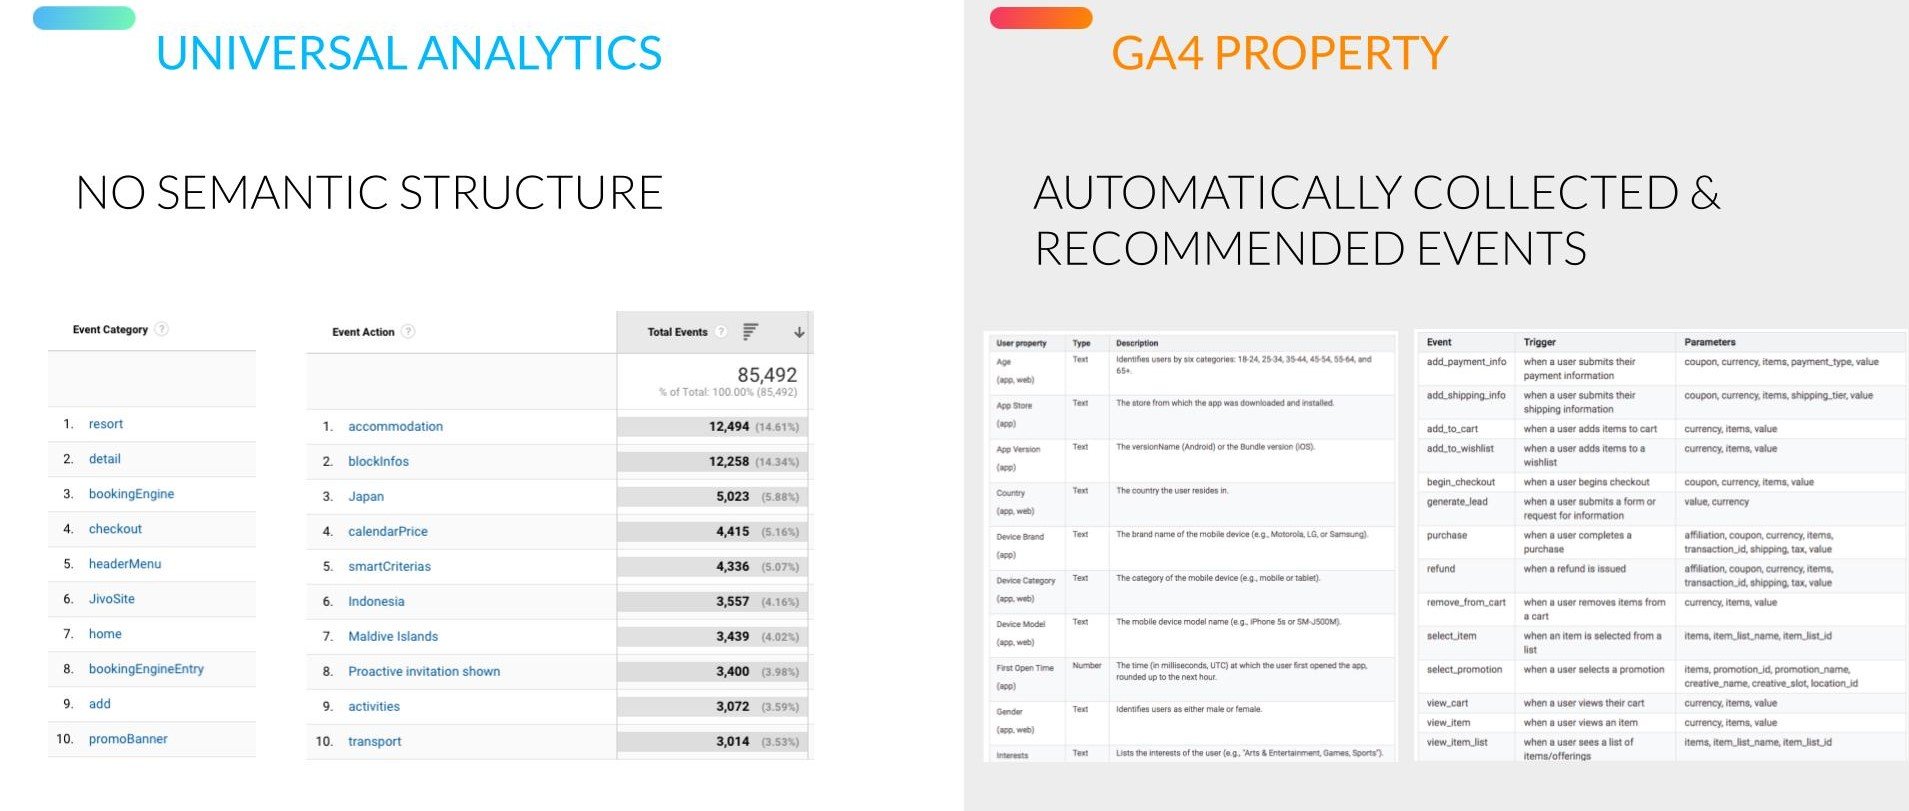
Google Analytics 4 is not simply the upgrade to Universal Analytics. It is an entirely new version and redesign of the tool. It is the new generation of Google Analytics that will allow you to collect data from both apps and the web.
Google Analytics Through the Years
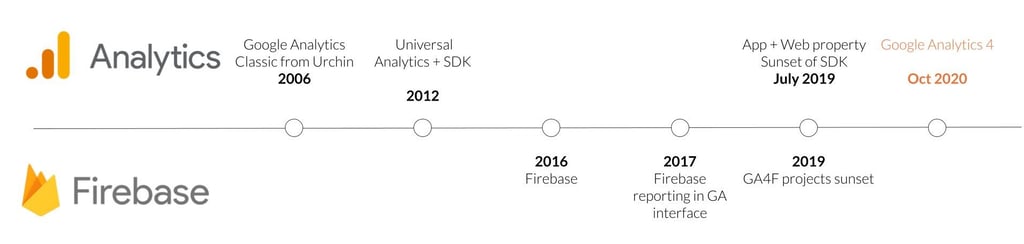 Let’s start with a bit of history.
- Google Analytics was created in 2006 when the group bought Urchin: this is what we called Classic Analytics.
- Then 6 years later, in 2012, Universal Analytics and the SDK were released. This was a major milestone.
- In 2016, Google launched Firebase Analytics, which was later rebranded to Google Analytics for Firebase and became the recommended approach for trackings apps.
- While Universal Analytics was using a session-driven data model, Google Analytics for Firebase introduced an event-driven data model: more flexible and effective working across various platforms.
- In 2017, Google made Firebase Analytics directly available in the UI before they introduced App + Web property (the early version of what we call now Google Analytics 4).
- Google Analytics 4 was released late last year. It is not a new version of Universal Analytics. It is closer to a new version of Firebase Analytics: the UI, the data model but also features.
Google Analytics 4 for Unified Reporting & Analysis
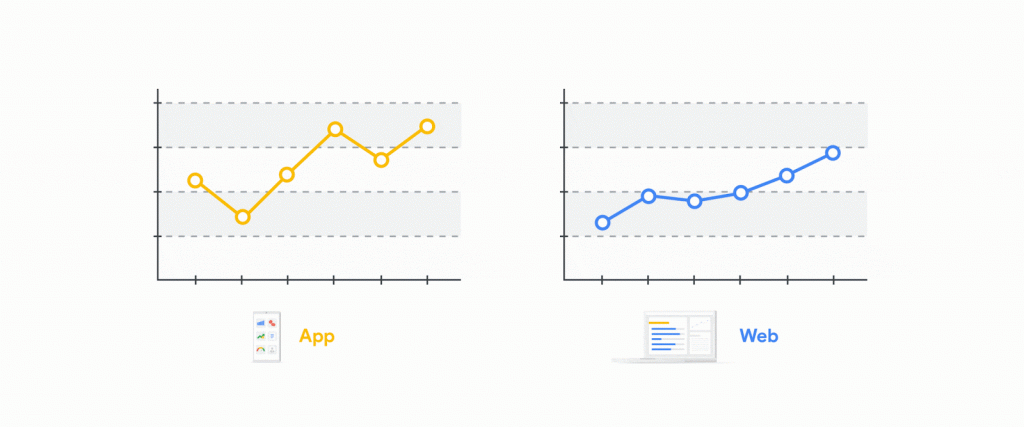 In July 2019, Google introduced a new property type, App + Web, that allows you to combine app and web data for unified reporting and analysis. Reports for this new property use a single set of consistent metrics and dimensions, making it possible to see integrated reporting across app and web like never before.
App + Web is not an upgrade to Universal Analytics; it is an entirely new version of Google Analytics that uses an event-driven data model. An entirely new set of reports comes with this new data model. It is designed to allow for flexibility in collecting analytics data from both web and app platforms.
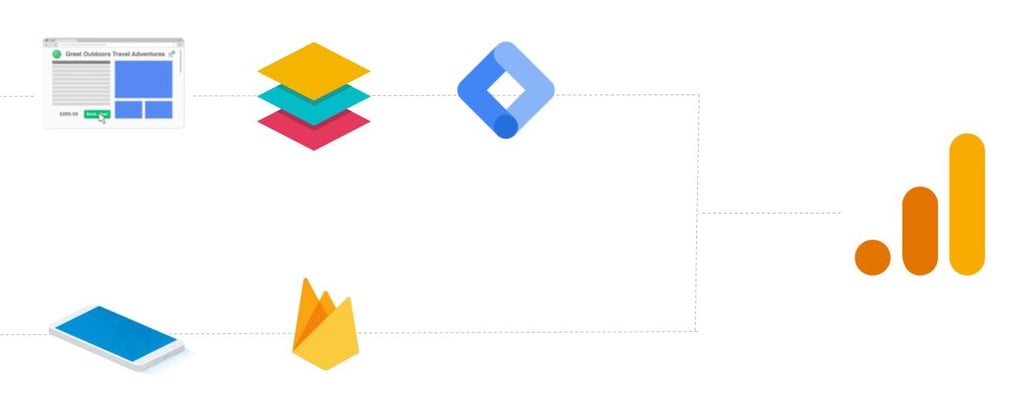
Streams to Collect Google Analytics 4 Data
 The 4 Benefits of Google Analytics 4 (According to Google)
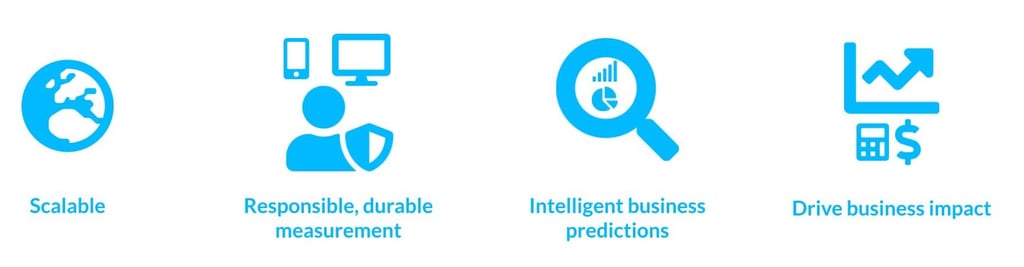 Scalable
From session-based & sampled reporting with limited flexibility to flexible reporting and analysis that is event-based, unified and unsampled.
Responsible, durable measurement
From web-focused measurement to privacy-centric measurement with cross-platform insights.
Intelligent business predictions
From limited automation and options to curate reporting to be more relevant to business to Google’s Machine learning to predict custom actions and improve business outcomes.
Drive business impact
From single-device media integration & rule-based attribution to cross-platforms ads integrations & native data-driven attribution.
What’s New?
The Top 5 Cool Features of Google Analytics 4
- Cross-platform data unification
- New AI-powered insights and predictions
- Audience Trigger
- Access to a BigQuery streaming export
- Advanced Analysis tool
Cross-Platform Unification
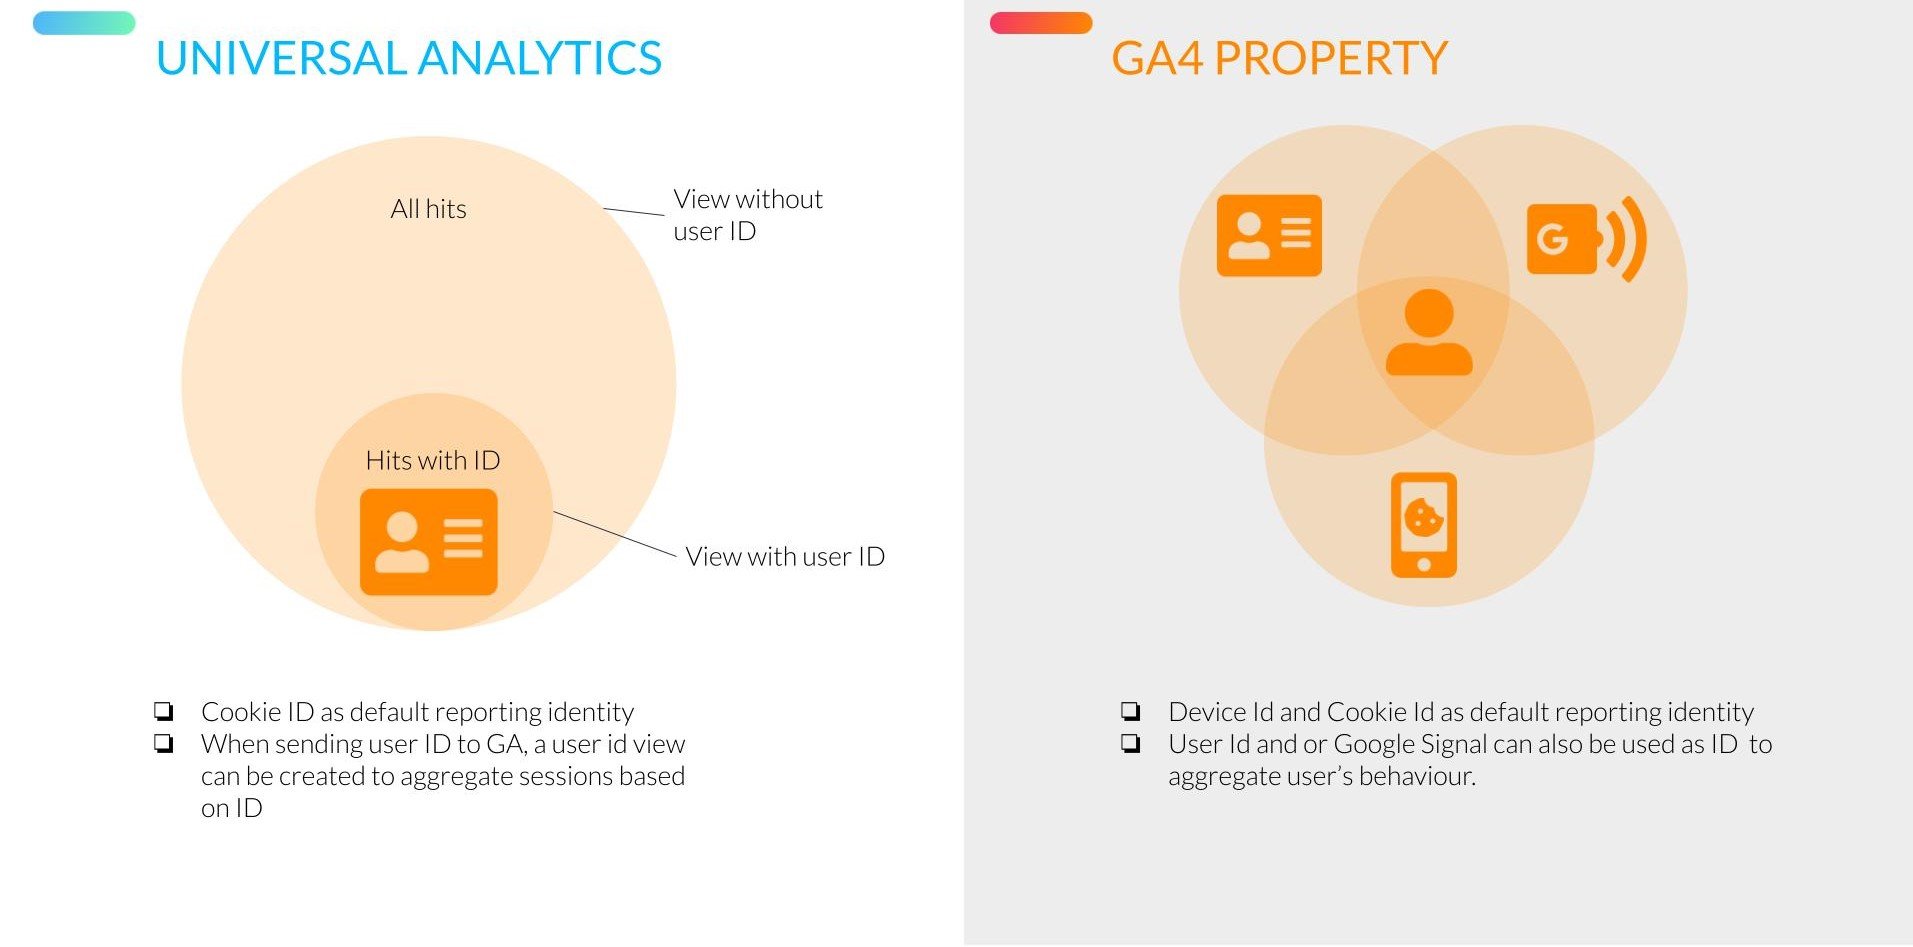
Google Analytics 4 proposes 3 different methods to identify users: User ID, Google Signals and Device ID. Once identified, Analytics creates a single user journey from all the data that is associated with the same user ID.
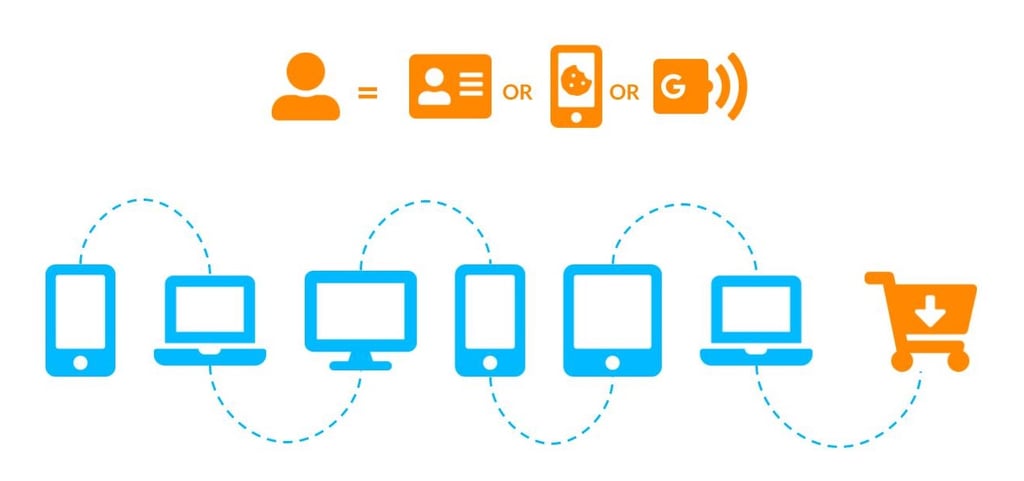
- User ID: ID provided via the data collection using the ID for logged-in users for instance.
- Google Signals: Google collects session data from sites and apps that Google associates with users who have signed in to their Google accounts, and who have turned on Ads Personalization.
- Device ID: The ID from the Google Analytics cookies (web) or from the app instance ID (apps).
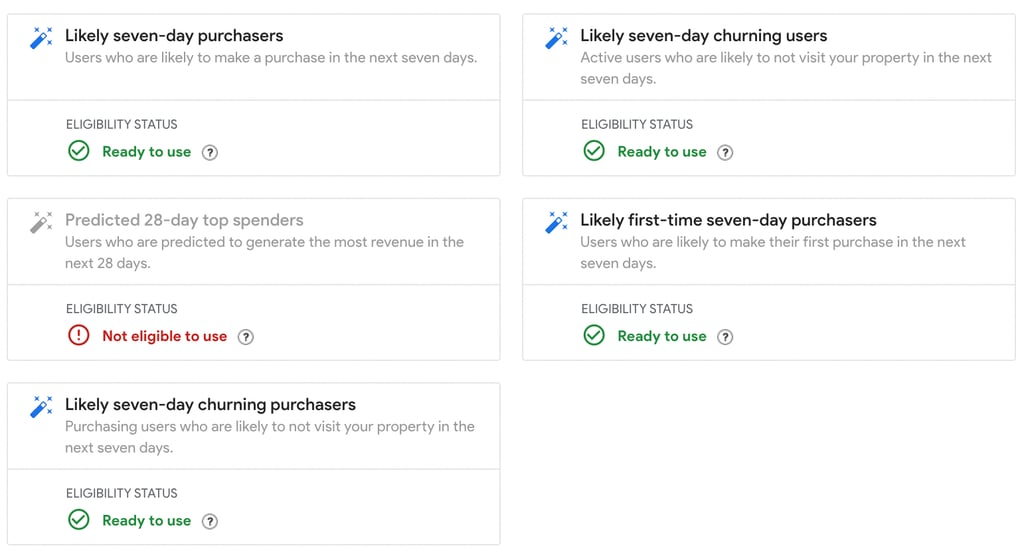
New Predictive Metrics
Understand the likelihood of user behaviour using one of the 3 predictive metrics available in Google Analytics 4.
- Predictive Churn (pChurn)
- Predictive Conversion (pConversion)
- Predictive Revenue (pRevenue)
Predictions are obtained using a model trained on the 28 days most-recent days of data and predict the behaviour of users within the next 7 days.
A minimum of 1,000 users for both positive and negative action is required to train the models.
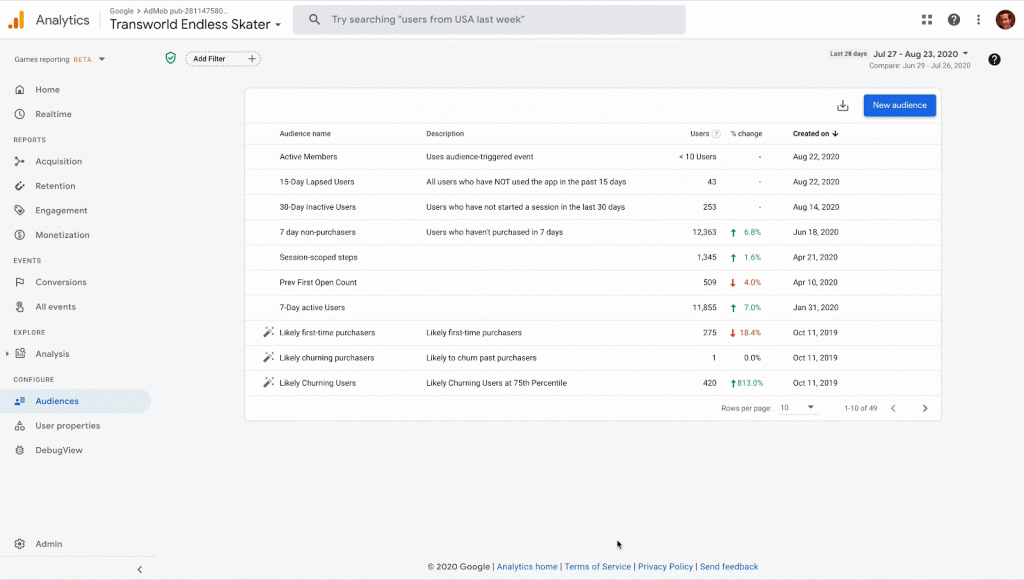
 Use Triggers to Create Powerful Audiences
Audience triggers let you trigger events when users match the definition of an audience and become members.
Create an audience when users reach key milestones in order to:
- Acquire loyal users / improve overall retention (based on lifetime session count)
- Acquire the most valuable users: trigger an event when users cross a threshold of lifetime value
- Leverage ML based audiences: harness the power of machine learning by building audiences using predictive metrics
- User your own criteria
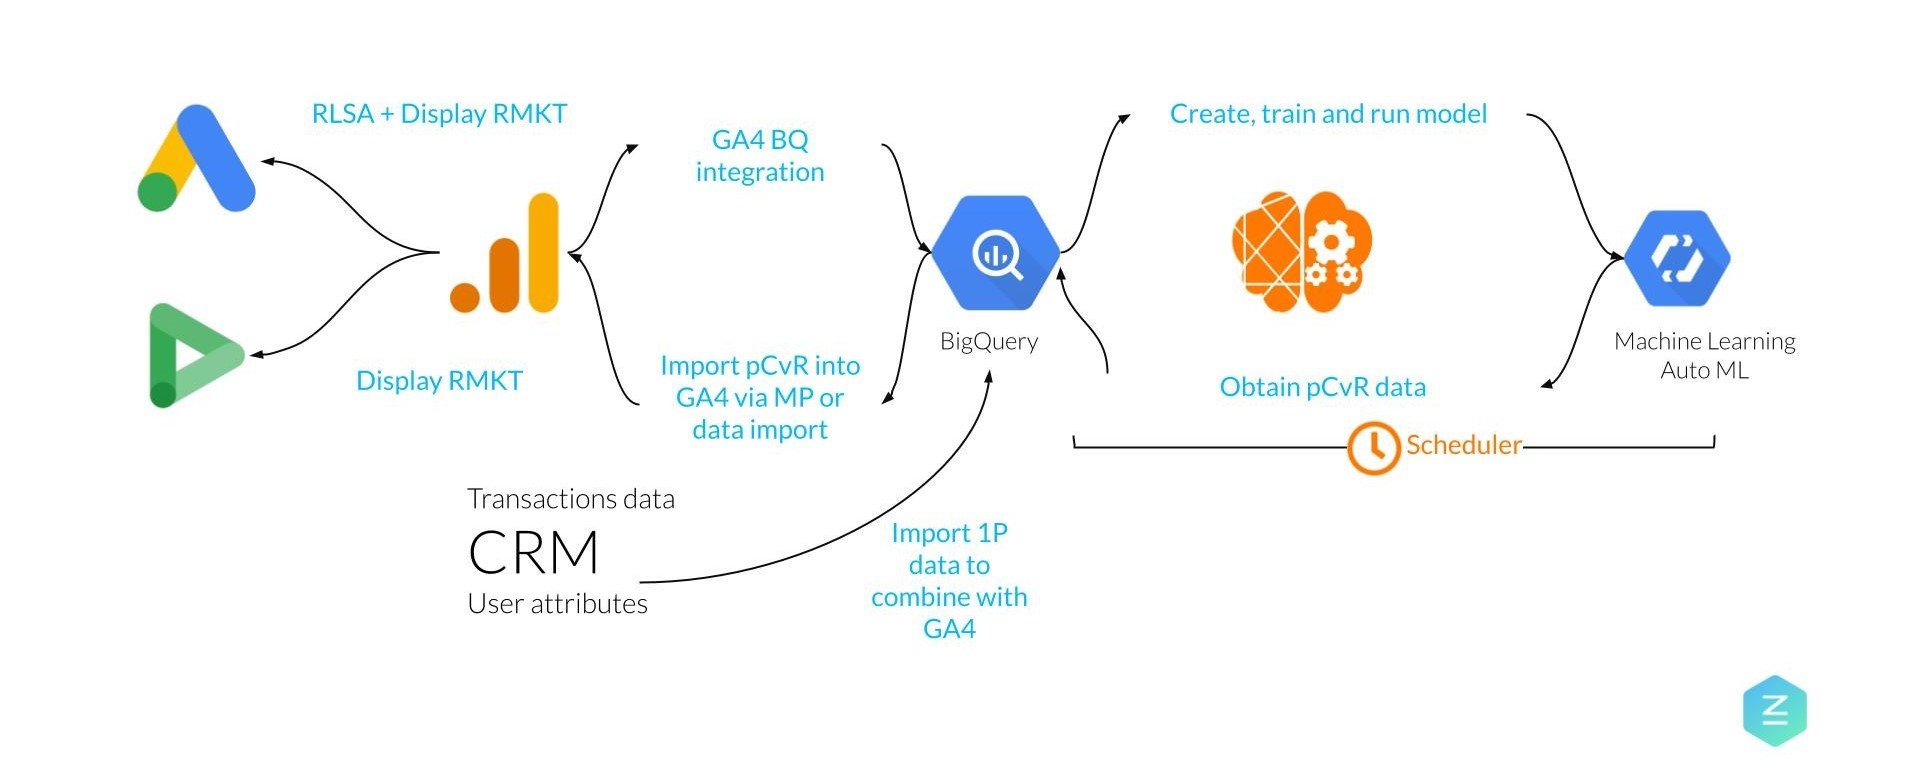
Train Your Own Models Using GCP
Google Analytics 4 provides access to raw/unsampled data from Google Analytics via its integration with BigQuery. GA4 data can be combined with other data sources and perform behavioural conversion prediction to acquire new customers, prevent churn, maximise revenue, improve ROAS, etc.
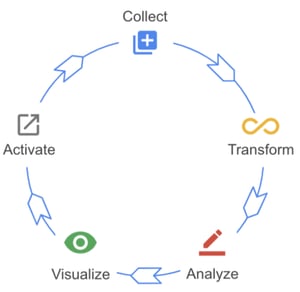
This was only previously available only in Google Analytics 360 accounts and is now available to anyone. The cost will then be on Bigquery: storage and queries.
Build Your Own Model Using Google Analytics 4 and CRM Data
Explore Your Data Using Analysis Hub
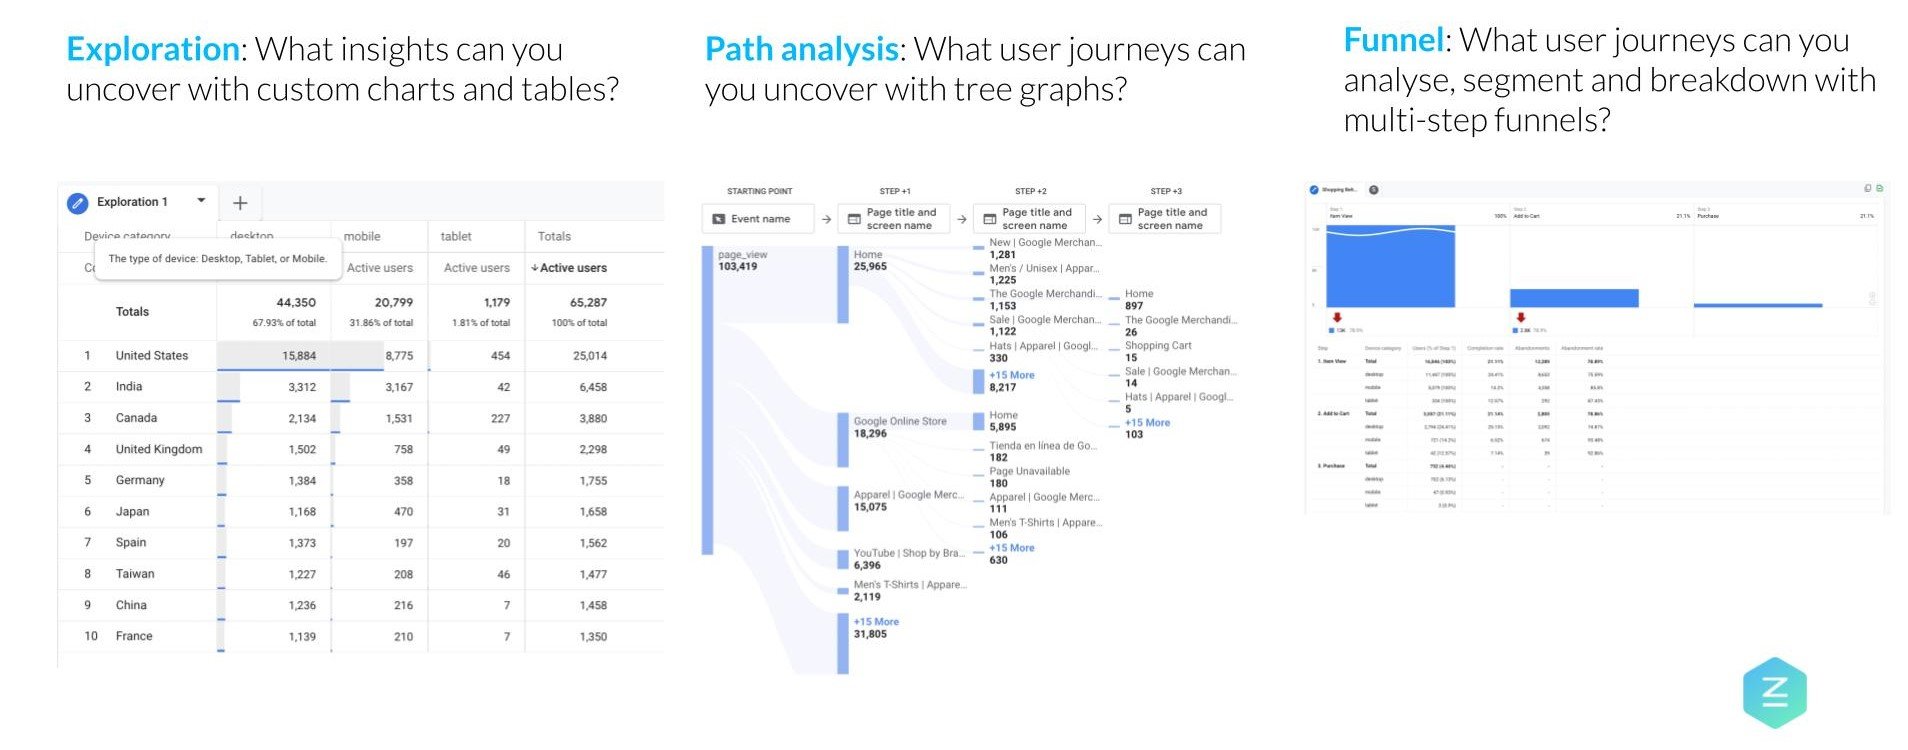
Analysis is a collection of advanced techniques that go beyond the standard reports to help you uncover deeper insights about your customers’ behaviour.
Once you’ve discovered interesting data sets, you can:
- Quickly perform ad hoc queries
- Easily configure and switch between techniques
- Sort, refactor, and drill down into the data
- Use filters and segments to focus on the data that’s most relevant to you
- Create segments and audiences
- Share your analyses with other users of the same Google Analytics property
- Export the analysis data for use in other tools
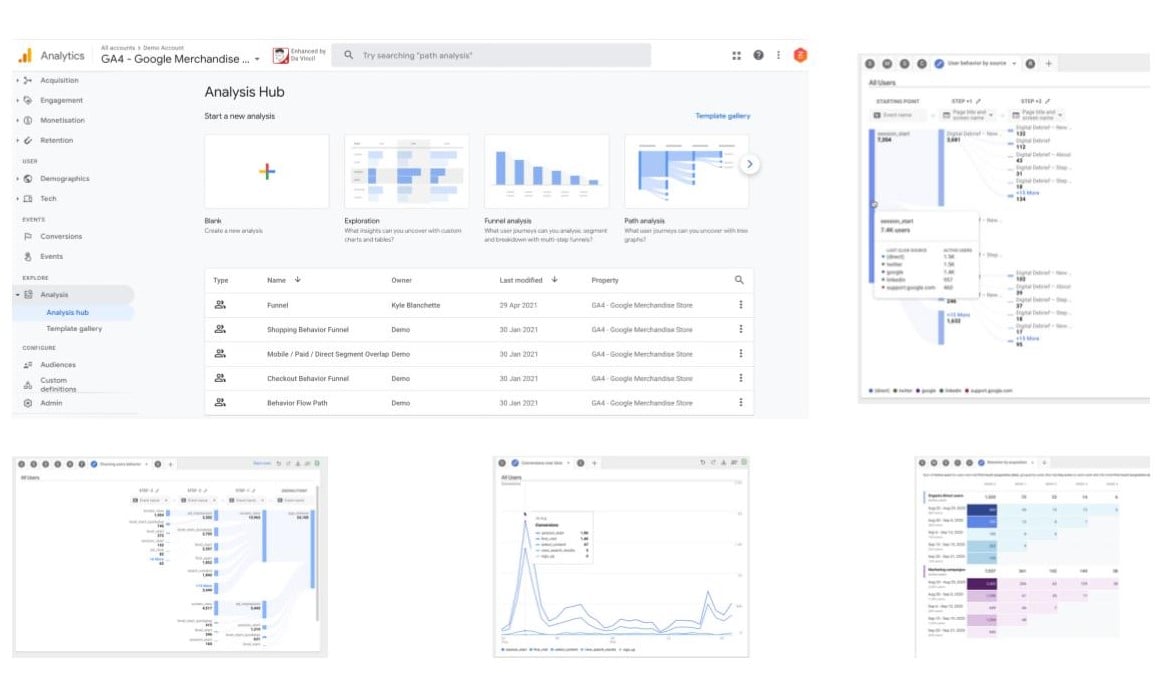
The Analysis hub enables you to explore your data in depth. Perform ad hoc queries, visualise and drill down into the data, filter and segment it as you want to better understand your users and act accordingly.
What’s Different?
Reporting Identity
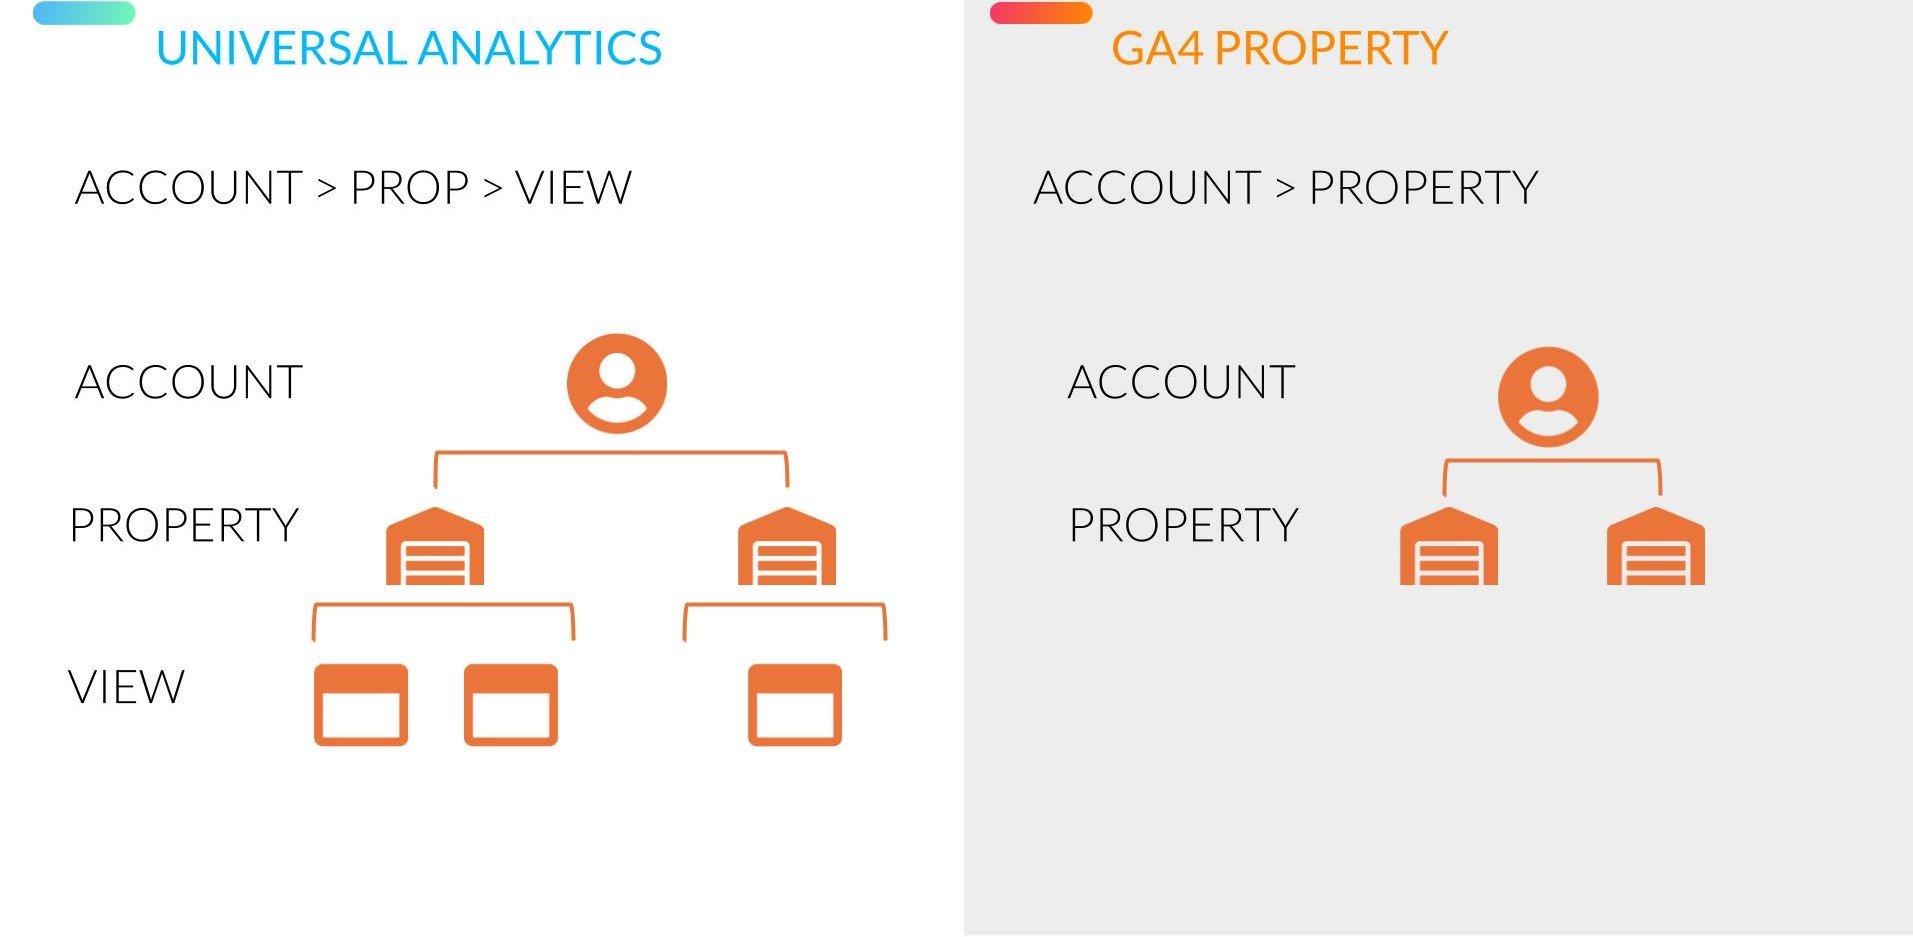
Account Structure
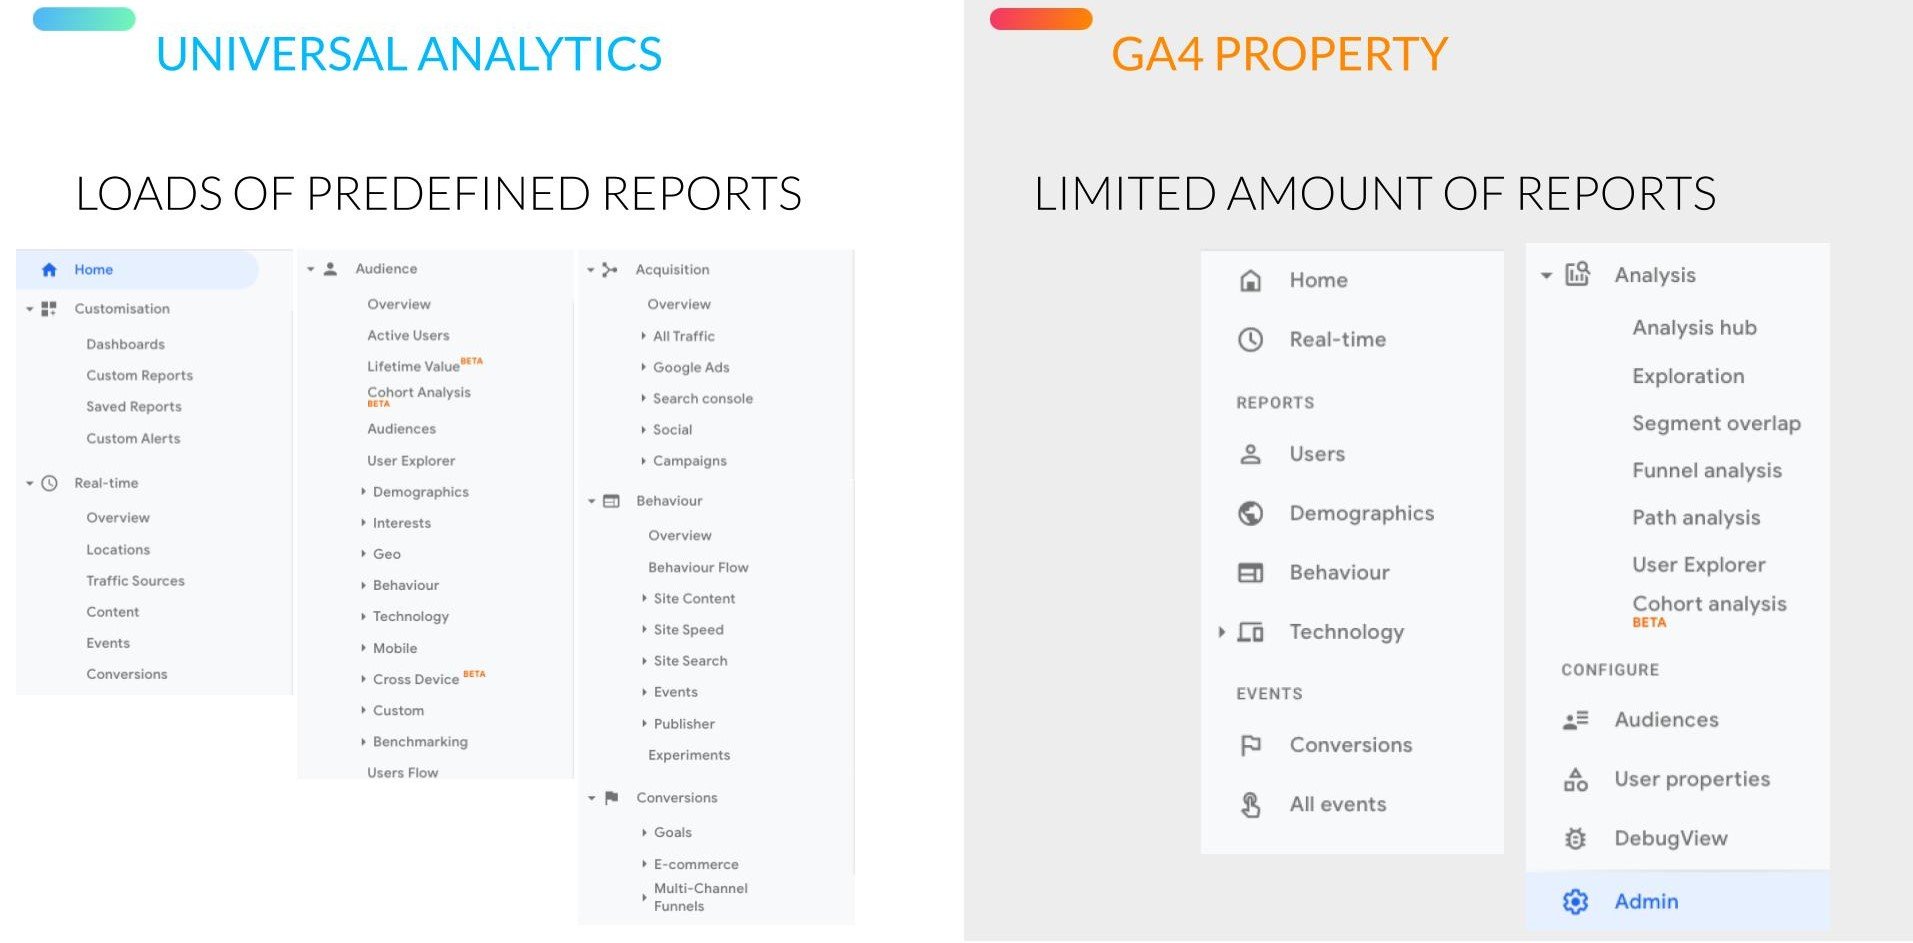
Predefined Reports
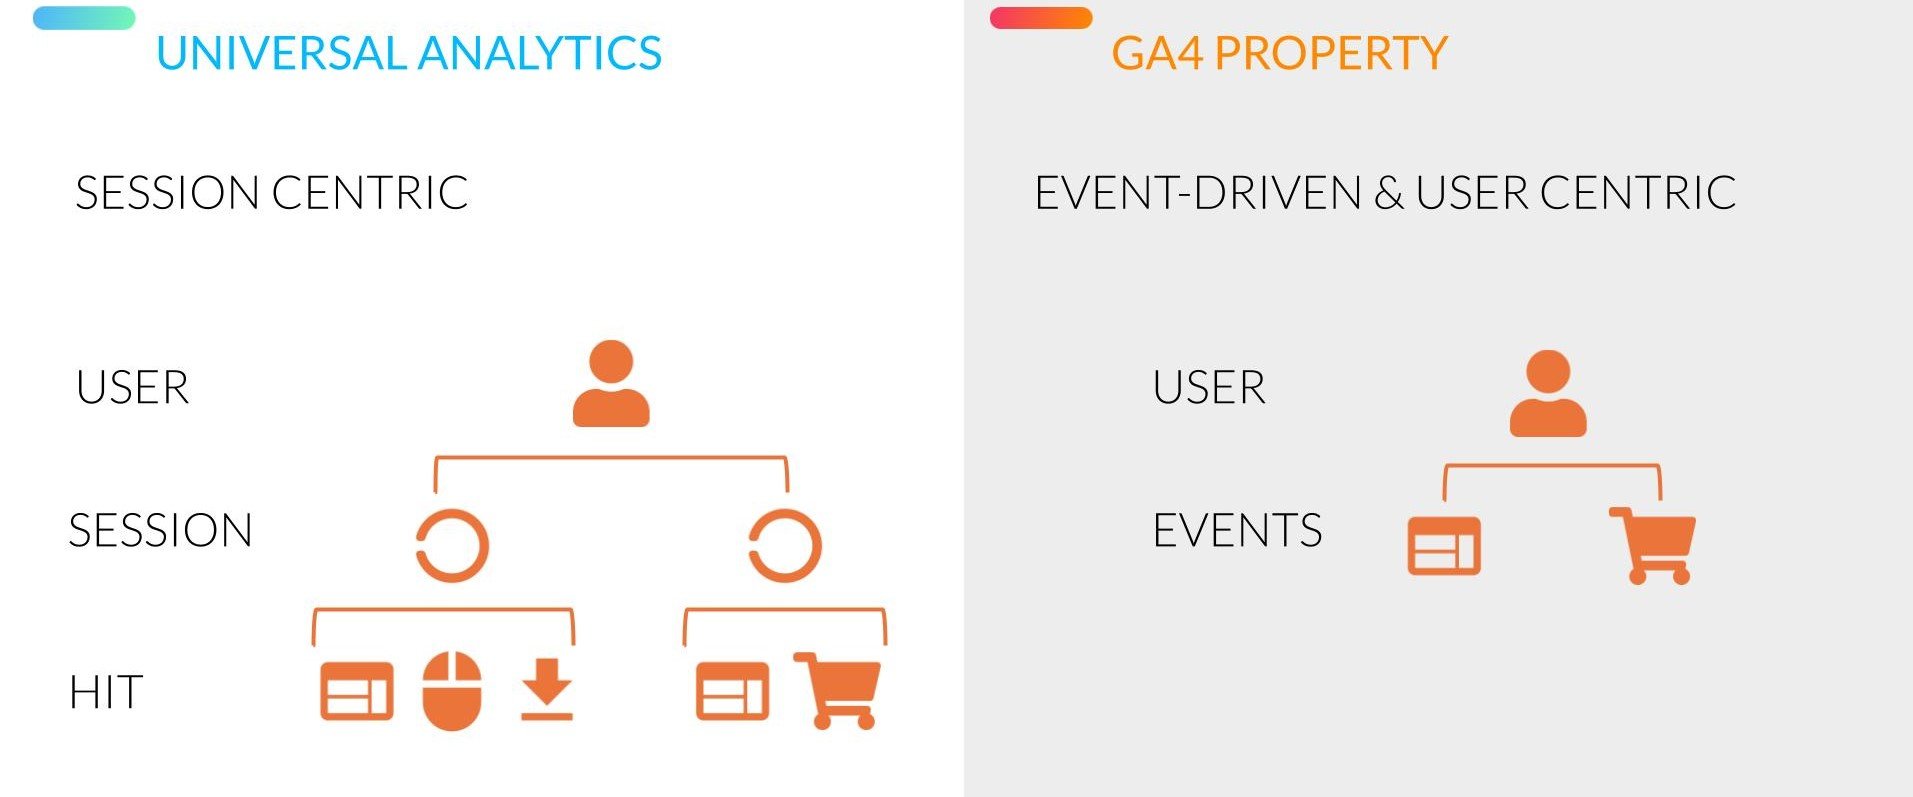
Data Models
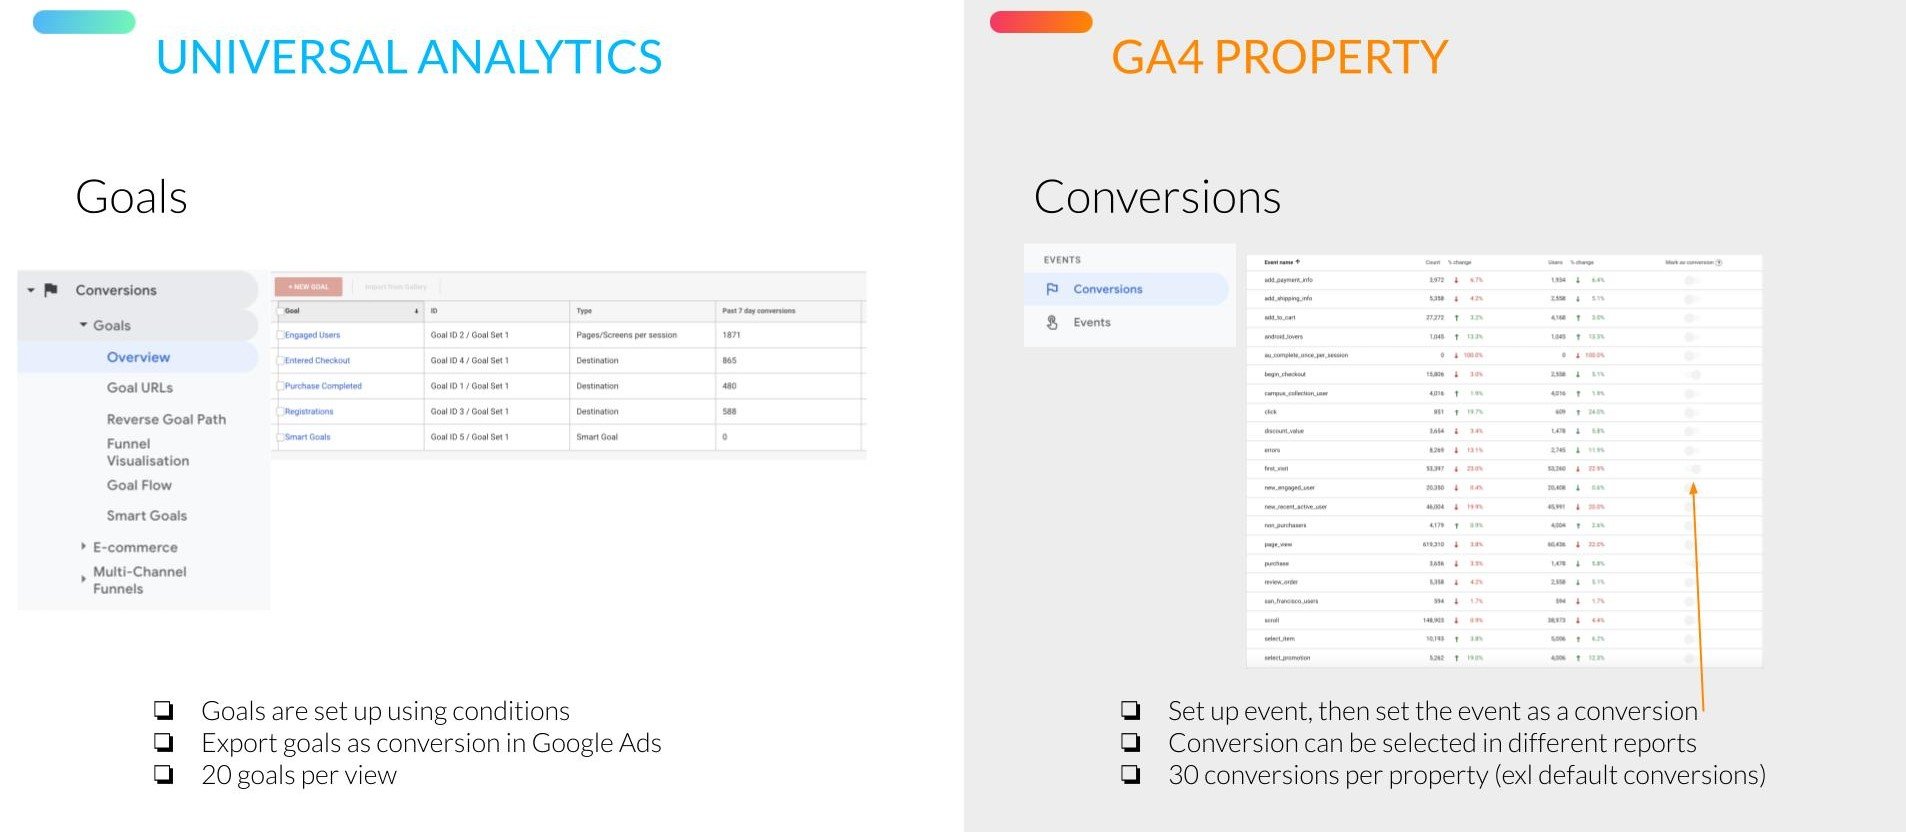
Goals Versus Conversions
Event Semantic
What Does Google Analytics 4 Look Like?
New UI: Report, Analysis, Configuration
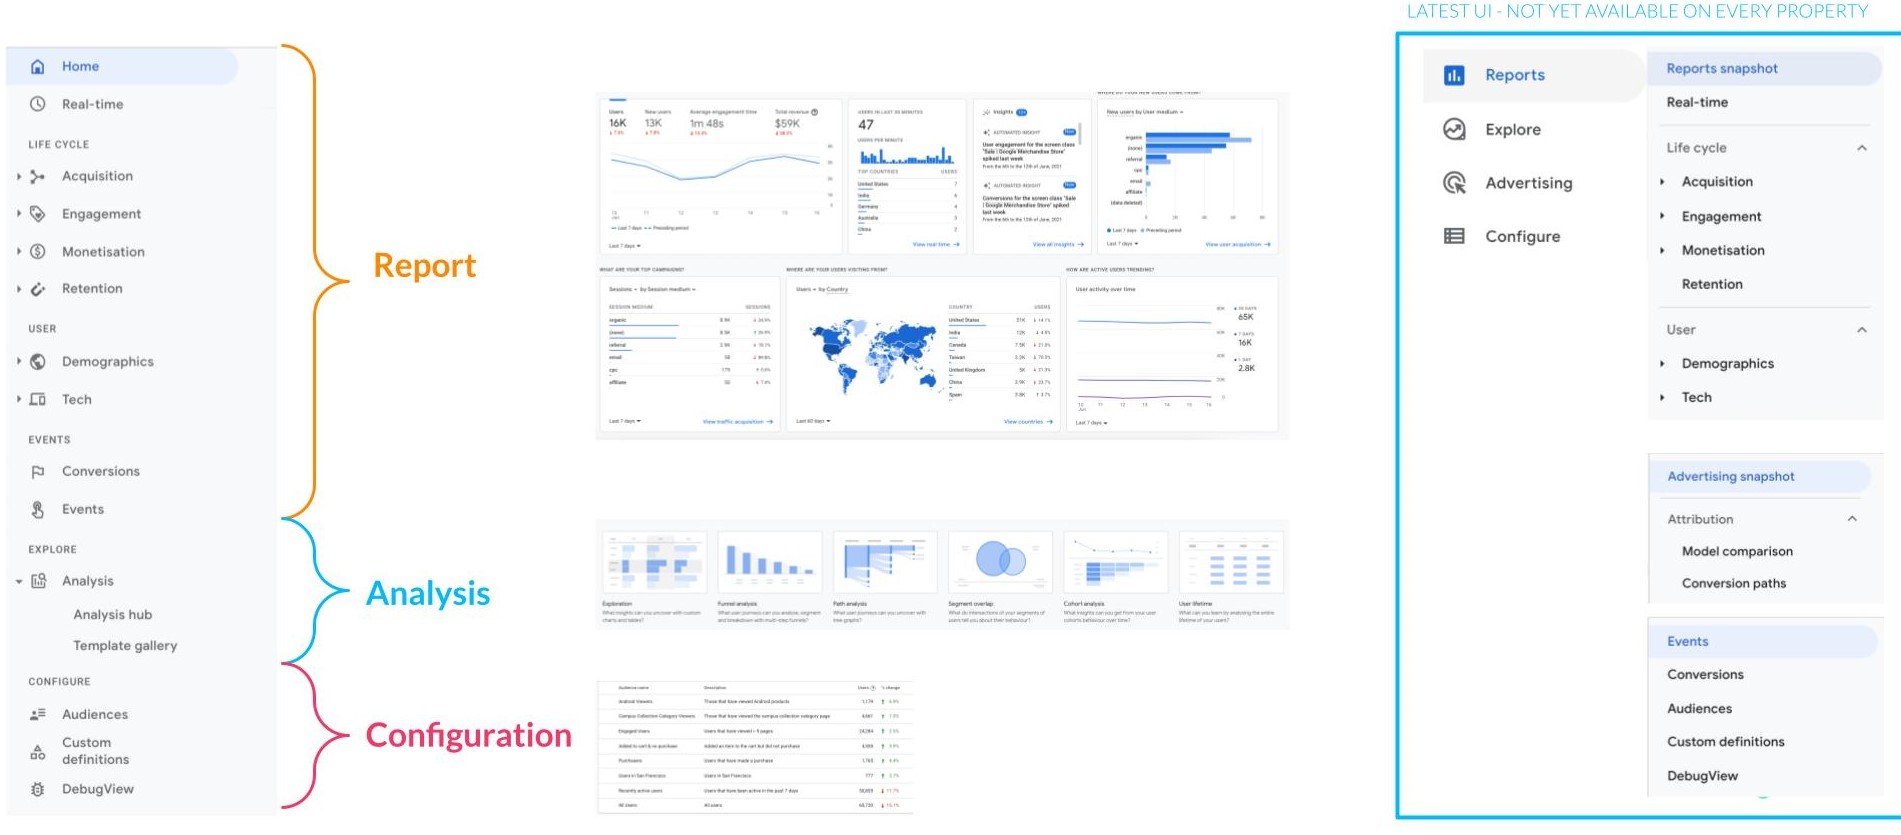
- Non-sampling report:
- Order by user life cycle: acquisition, engagement, monetization, retention
- User distribution: demographics, tech and audience
- Analysis: more flexible analytics platform including funnel analysis, path analysis, cohort… (sampling on analysis tool)
- Configuration: custom dimensions/metrics, audiences and debugview
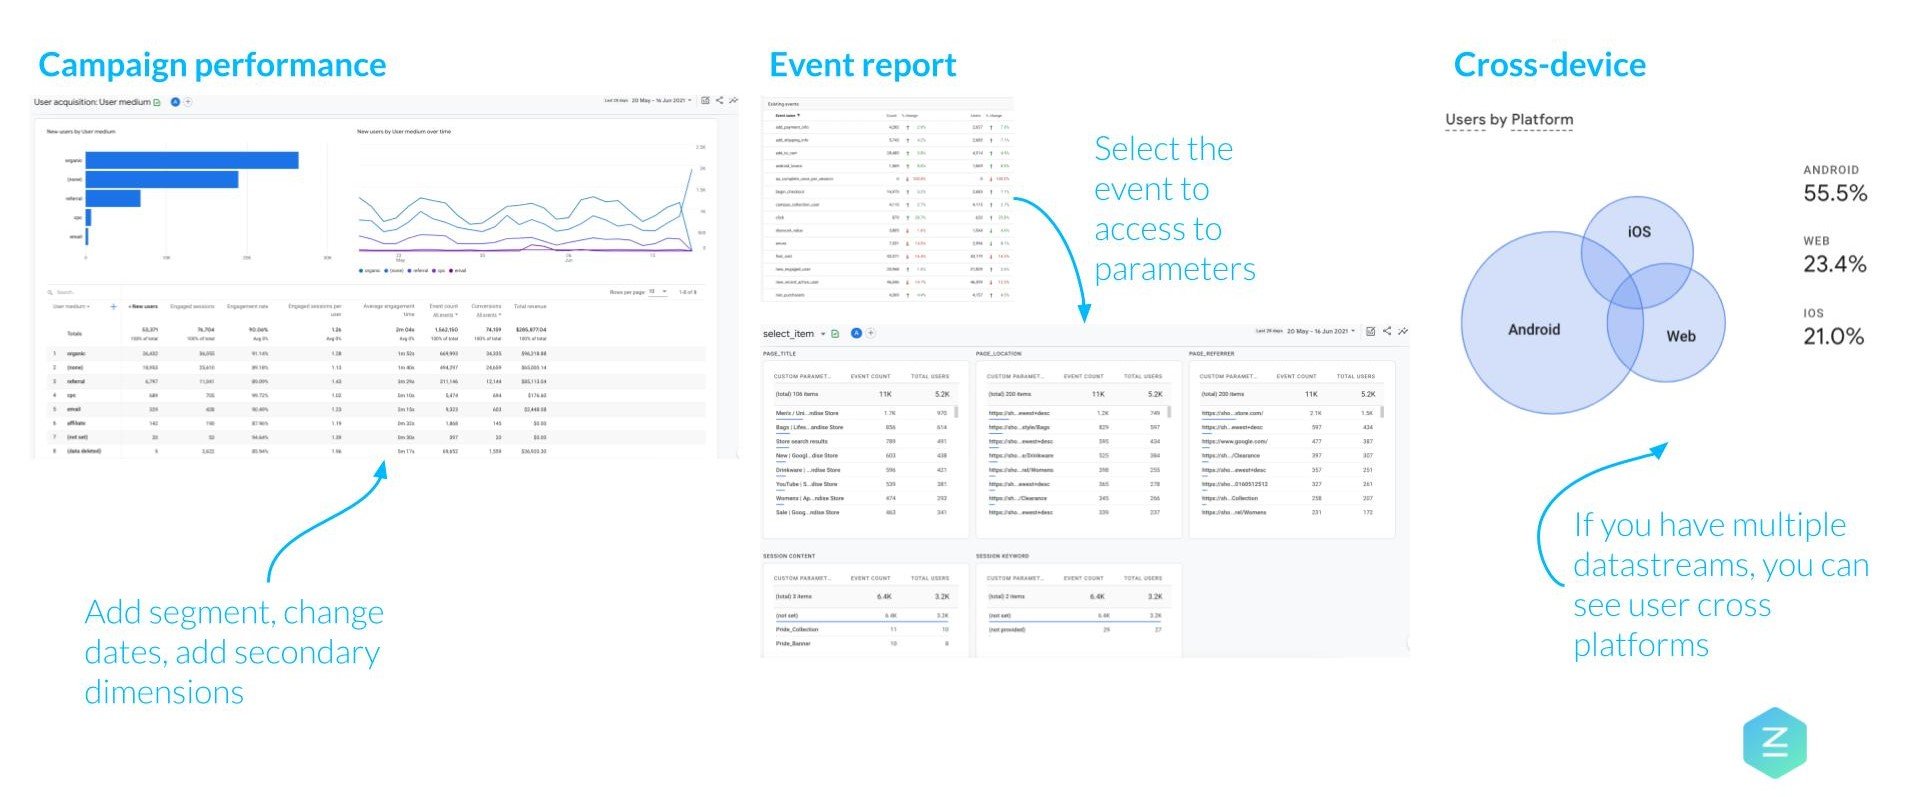
Walkthrough: 3 Built-in Reports
 Walkthrough: 3 Templates in Analysis Hub
What’s Next?
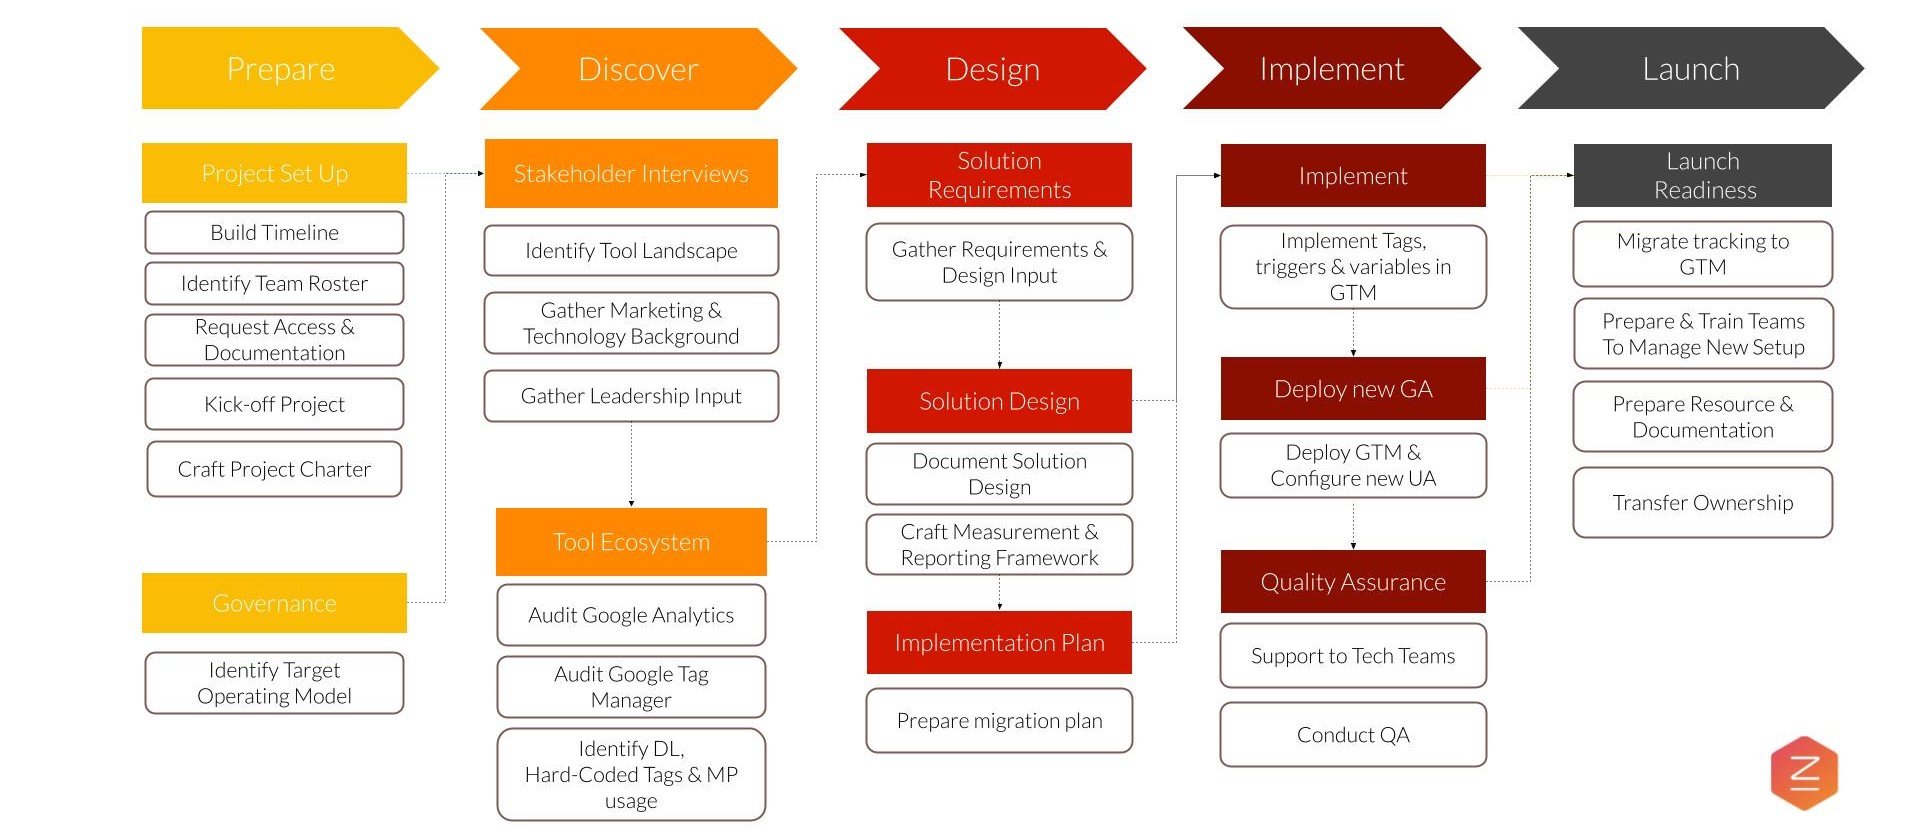
Prepare Your Migration to Google Analytics 4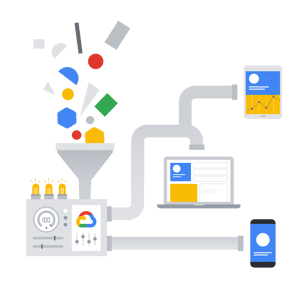
The current consensus is to begin the journey into Google Analytics 4 in parallel with Universal Analytics.
Implement a dual-tagging setup for your new GA4
- Option #1: GA4 Basic Measurement Setup
- Option #2: GA4 Advanced Measurement Setup
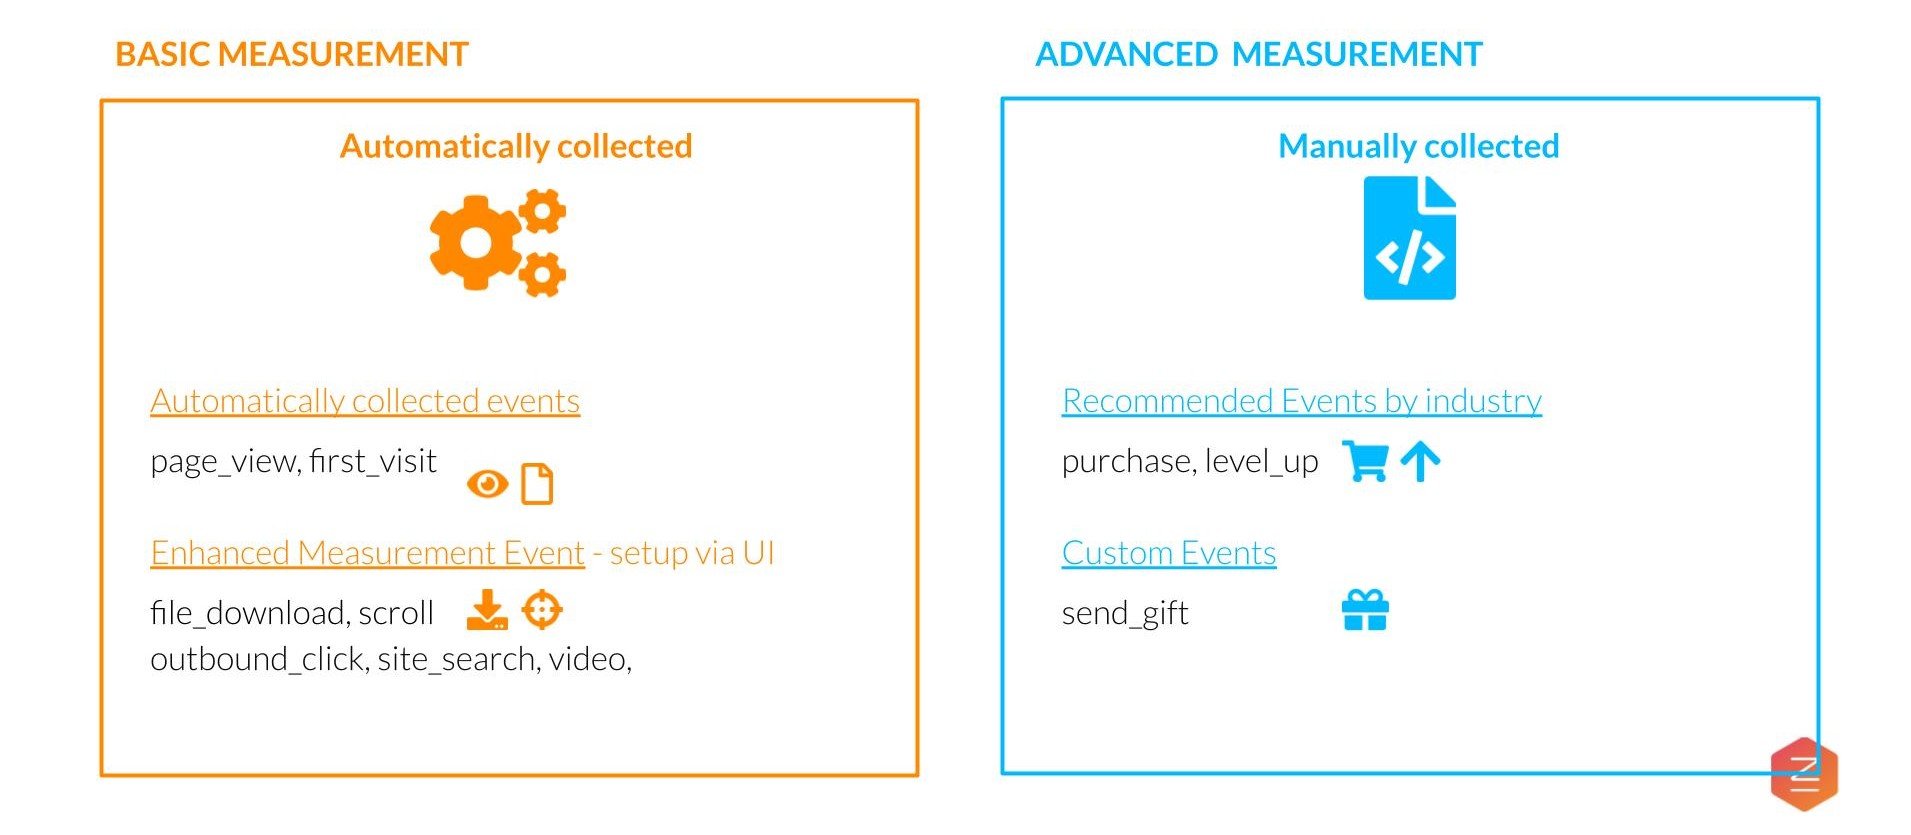
Basic and Advanced Measurements
Google Analytics 4 measurements can be classified into 2 categories: Basic and Advanced.
Basic Measurement
- Basic Measurement does not require modifying code
- Automatically-collected events
- Enhanced Measurement events
- Enable via GA property UI
- Sent automatically with associated parameters
Advanced Measurement
- Advanced Measurement requires modifying code
- Recommended events (aka suggested events)
- Events sent follow a predefined schema
- Provides forward-compatibility with upcoming features
- Custom events
- Events and relevant parameters that you define
Measurement for Google Analytics 4: Basic and Advanced
Option 1: Basic Measurement
Steps:
- Create a GA4 property
- Create the web data stream
- Activate enhanced measurements
- Enable Data Collection
When to choose option 1:
- Limited resources
- Low analytics maturity
- Limited reporting capabilities
Option 2: Advanced Measurement
Steps:
Full implementation cycle including additional development on existing apps and websites.
When to choose option 2:
- Available dev resources
- High analytics maturity
- Ecommerce and custom events required
This advanced measurement project is much more complete than basic.
Not only is it aiming to put in place an analytics program governance, but also set measurement across sites & app, document measurements and configuration as the implementation is done.
- Assess current UA measurements
- Assess current reporting needs
- Map existing to GA4
- Create implementation plan
- Implement dual tagging
- Implement recommended & custom events, custom with parameters and properties including eCommerce measurement
- Assure quality
- Launch
Key Components of a Google Analytics 4 Implementation